TikZ : Draw diagram using LaTeX
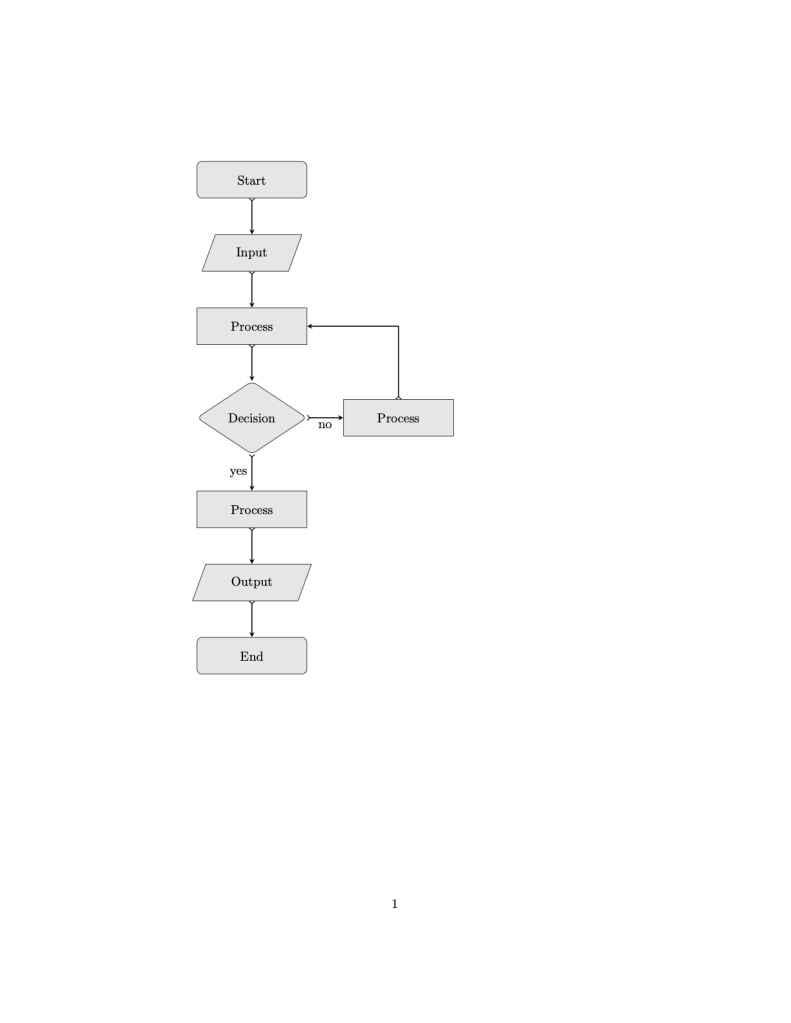
TikZ is a package that allows users to work with geometrical shapes to create different diagram. Here is a template for creating flowchart using TikZ package.
\documentclass{article}
\usepackage{tikz}
\usetikzlibrary{shapes.geometric, arrows}
\tikzstyle{startstop} = [rectangle,  rounded corners ,   minimum width = 3cm ,  minimum height = 1cm ,  text centered ,  draw = black, fill = black!10]
\tikzstyle{io} = [trapezium,  trapezium left angle = 70 ,  trapezium right angle = 110 ,  minimum height = 1cm ,  text centered ,  draw = black, fill = black!10]
\tikzstyle{process} = [rectangle,   minimum width = 3cm ,  minimum height = 1cm ,  text centered ,  draw = black, fill = black!10]
\tikzstyle{decision} = [diamond,  rounded corners ,   minimum width = 3cm ,  minimum height = 1cm ,  text centered ,  draw = black, fill = black!10]
\tikzstyle{arrow} = [thick, ->, >-stealth]


\begin{document}

\begin{tikzpicture}[node distance = 2cm]

\node (start) [startstop]{Start};
\node(input) [io, below of = start]{Input};
\node (processOne) [process,  below of = input]{Process};
\node (decision) [decision, below of = processOne, yshift= -.5cm]{Decision};
\node (processTwo) [process,  right of = decision, xshift = 2cm]{Process};
\node (processThree) [process,  below of = decision, yshift=-.5cm]{Process};
\node (output) [io, below of = processThree]{Output};
\node (end) [startstop, below of = output]{End};


\draw [arrow] (start) -- (input);
\draw [arrow] (input) -- (processOne);
\draw [arrow] (processOne) -- (decision);
\draw [arrow] (decision) -- node[anchor = east] {yes}(processThree);
\draw [arrow] (decision) -- node[anchor = north] {no}(processTwo);
\draw [arrow] (processTwo) |- (processOne);
\draw [arrow] (processThree) -- (output);
\draw [arrow] (output) -- (end);

\end{tikzpicture}

\end{document}
Comments
Post a Comment